

Know Where You Stand
You cannot fix what you cannot see.
Find the gaps holding back your business value.
What is a PAR?
Stop guessing.
The PAR shows where you're strong, where you're exposed, and where you're leaving money on the table.
It looks at the financial, operational, and strategic areas that drive or destroy business value.
Instead of relying on gut feel, you get a clear path forward based on real numbers.
Fix the leaks. Double down on what works. Grow with confidence.
Customer & Team Dependence
If one client or one employee controls your revenue, that’s a risk. The PAR shows how to balance your business.
Financial Weak Spots
Margins too low? Cash flow too tight? The PAR makes it obvious—so you can fix it before it costs you.
Operational Drag
Too much waste, too many handoffs, or broken systems? The PAR helps you tighten things up fast.
See How You Stack Up
Are you beating the average—or falling behind? The PAR benchmarks your performance against your industry.
How it Works:

Step 1: Upload Financials
Securely upload your business tax returns or financial statements. We accept PDFs and Excel files from tools like:
- QuickBooks
- Xero
- Lacerte
- ProSeries
- CCH ProSystem fx
These files give us the raw data needed to begin financial benchmarking and performance analysis.

Step 2: We Analyze
We benchmark your numbers against industry standards to show how your business stacks up against similar companies. Using scoring models, we evaluate key drivers of performance like:
- Profitability
- Efficiency
- Financial health
Metrics like net margin, debt-to-equity, and asset turnover reveal where your business stands relative to your competition, and what’s holding it back.

Step 3: Get Your Report
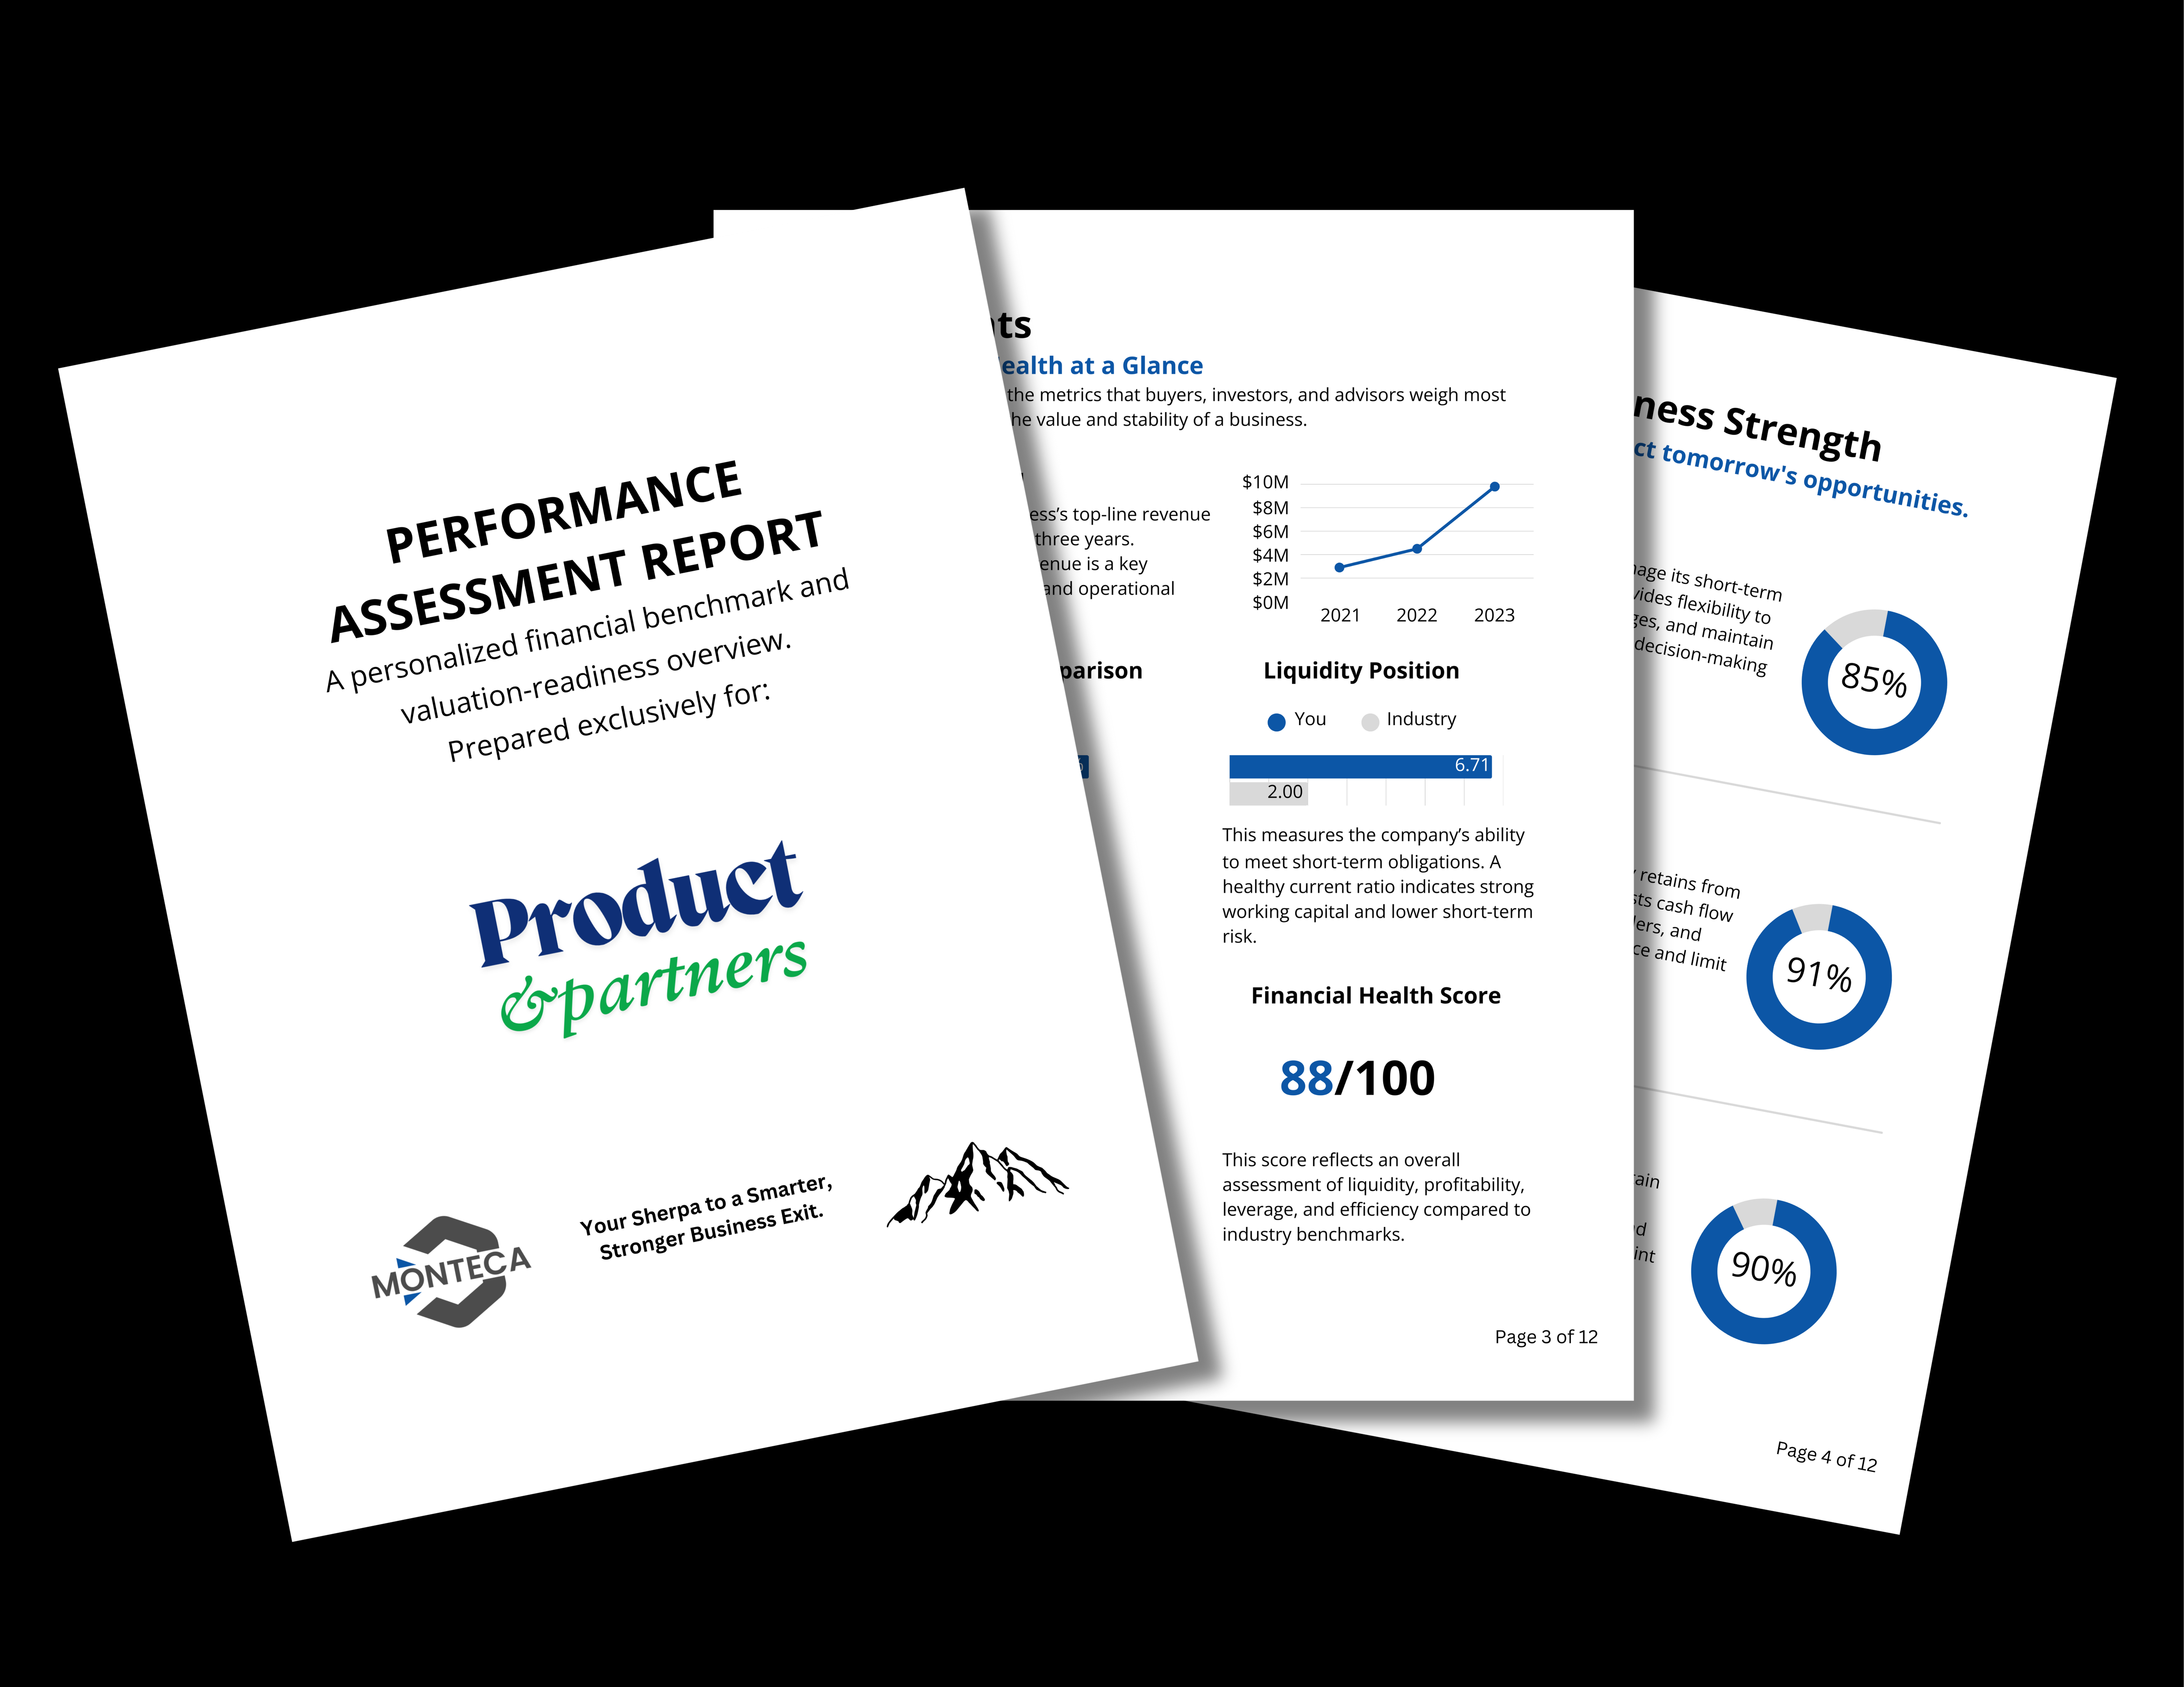
You’ll receive a personalized Performance Assessment Report (PAR) with:
- Visual dashboards
- Financial scores
- Actionable recommendations
This isn’t just a summary—it’s a strategic tool to help improve performance, reduce risk, and plan for a stronger future or exit.
How it Works:
Step 1: Upload Financials
Securely upload your business tax returns or financial statements. We accept PDFs and Excel files from tools like:
- QuickBooks
- Xero
- Lacerte
- ProSeries
- CCH ProSystem fx
These files give us the raw data needed to begin financial benchmarking and performance analysis.
Step 2: We Analyze
We benchmark your numbers against industry standards to show how your business stacks up against similar companies. Using scoring models, we evaluate key drivers of performance like:
- Profitability
- Efficiency
- Financial health
Metrics like net margin, debt-to-equity, and asset turnover reveal where your business stands relative to your competition, and what’s holding it back.
Step 3: Get Your Report
You’ll receive a personalized Performance Assessment Report (PAR) with:
- Visual dashboards
- Financial scores
- Actionable recommendations
This isn’t just a summary—it’s a strategic tool to help improve performance, reduce risk, and plan for a stronger future or exit.
What to Expect — Step by Step
We keep it secure, simple, and risk-free—so you stay in control.
Tier 1 – Performance Snapshot
- Quick intake form (revenue, COGS, net income)
- No uploads or documents required
- We benchmark your numbers and send a 3-page summary
- Delivered in 2–3 business days
- Upgrade anytime with full credit toward Tier 2
Tier 2 – Full Performance Assessment Report
- We start with a Mutual NDA so you're protected
- Secure upload of 3 years of P&L and balance sheet
- We run full diagnostics, benchmark scoring, and exit-readiness checks
- Delivered in 5–7 business days
- Includes a 20-min strategy call with a trusted advisor
Your Sherpa to a Smarter, Stronger Business Exit.
© 2026 Monteca Group, LLC - All Rights Reserved,

Your Sherpa to a Smarter, Stronger Business Exit.
© 2026 Monteca Group, LLC - All Rights Reserved,